
Introduction to Big Data
The term big data has been around for quite some time and the initial hype associated with the topic is already long over and replaced by different topics, like the internet of things and artificial intelligence, especially deep neural networks. However, big data is closely related to these topics and can be, to some degree, seen as an enabler and important related technology.
Unfortunately, many people still do not understand what makes data big, what is special about big data, and the implications of having problems that either produce or require big data. These misunderstandings are mainly because we instinctively assign a meaning to the term big in the sense of large. Consequently, the naive definition of big data would be that this is just a large amount of data. However, only the amount of data is not sufficient to make data into big data. Consider, for example, the backups that modern compute centers store on high volume storages, that often have a high latency. This is certainly a large amount of data, but also certainly not big data. Moreover, defining big data just using the size would be impractical, because we would have to change the definition repeatedly, because our storage, computational, and memory capacities are constantly increasing.
A better and well accepted definition of big data is based on the three Vs [Gartners IT Lexicon]:
Definition of big data:
Big data is high-volume, high-velocity and/or high-variety information assets that demand cost-effective, innovative forms of information processing that enable enhanced insight, decision making, and process automation.
Let us dissect this definition and consider the individual parts to understand why big data is more than just size.
Volume
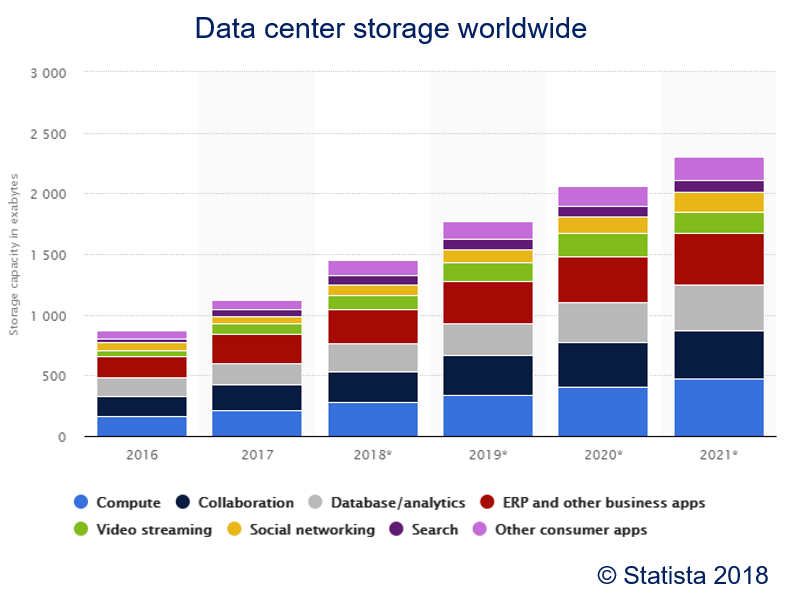
The volume of the data is an important factor. However, as discussed above, there is no exact number that makes data big. In the year 2006, when Google published the landmark Map/Reduce paper, one Terabyte was a huge amount of data. In the year 2020, this is the storage of my laptop. A simplistic definition is that big data does not fit in the memory. A better guideline is that big data is too large to be copied around (very often), especially over the network. Due to this, big data is sometimes not even copied from the network but with the Sneaker Net, for example, for the creation of the first image of a black hole.
Velocity
The velocity deals with the speed at which new data is created, processed, and/or evaluated. Examples for high velocity data are the different sensors in self-driving cars (LIDAR, Cameras, ...). Such data can become large really fast. For example, Waymo released compressed data from about eleven hours of driving which is two Terabytes of data [Waymo Open]. Data that is produced at such high speeds is also called stream data. Often, streaming data must be processed in (nearly) real-time. Thus, there are not only requirements on being able to receive large amounts of data that are created rapidly, but also to process and evaluate this data in a timely manner. Consequently, one might say that there is an inverse correlation between the velocity and the volume when it comes to deciding if data is big: the higher the velocity, the smaller the volume that is required to make data big. The reason is quite simple: processing one Gigabyte in one hour is simple, processing one Gigabyte per second is a different problem.
Variety
The variety is the third aspect of big data. Today, the analysis of images, videos and text has become a relatively normal application. However, this was not the case when the term big data was initially coined. Then, most data was held in data warehouses with defined structures, for example, relational databases. The data were mostly numeric or in fixed categories. This began to change when the Internet started to grow into the almost all-encompassing web of knowledge and content we have today. It is no coincidence that Google was at the forefront of the development of big data technologies, because the initial driver was indexing the Internet to enable efficient queries for finding content. This meant that unstructured data, like websites must be indexed and information retrieval algorithms must be executed against this data. The amount of unstructured data is vastly more than that of structured data. Typically, the relation between data structuring and the volume of data is depicted as a pyramid.
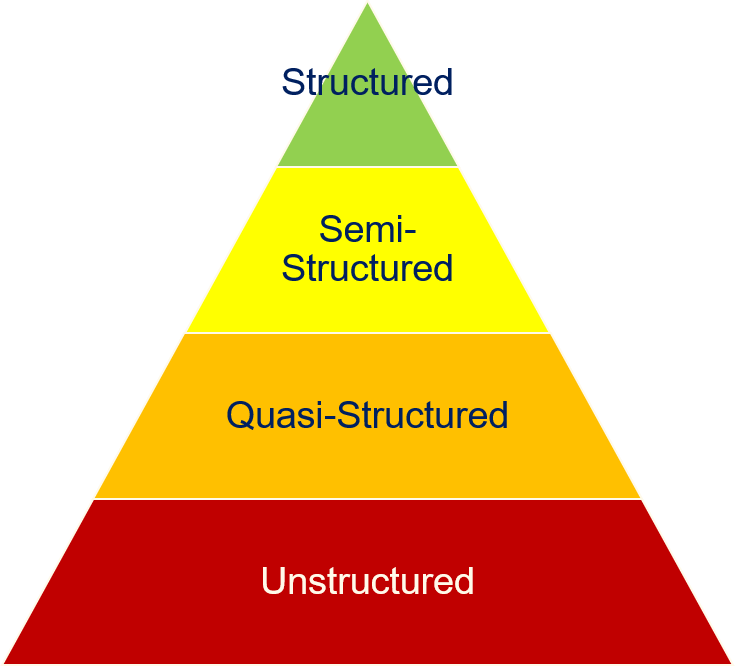
At the top of the pyramid is the structured data, e.g., tables, comma separated value files and similar. Often, this data can be directly analyzed and pre-processing is only required for data cleaning, e.g., the detection of invalid data or outliers.
Next, we have semi-structured data, e.g., XML or JSON files. The main difference between structured and semi-structured data is that semi-structured data formats are often more flexible. For example, each row in the table of a relational database must have values for exactly the same columns. With XML and JSON, the fields are usually similar, but may have structural differences, e.g., due to optional fields.
The first two layers of the pyramid are defined data formats for which there are usually query languages and/or libraries for the extraction of information. This is not the case on the bottom layers. Quasi-structured data has a fixed structure, but not in a convenient and easily accessible data format. For example, consider the output of the ls -l command.
%ls -l
There certainly is a discernable structure in the output, i.e., most lines contain a summary of the user rights, followed by the number of links, the user and group who own the file, the size, the data of the last change, and the name. This structure can be exploited to define a parser for the data, for example, using regular expressions. Thus, we are able to impose a structure on the quasi-structured data, by defining the meaning of the structure on our own and writing our own parsers for the data. A potential problem with quasi-structured data is that these data formats are often not very reliable and may change. For example, ls could separate fields with tabulators instead of spaces, which would break most parsers. There is no protection against such changes, which makes such parsers fragile and may mean that significant effort must be invested for the maintenance of parsers for quasi-structured data in production environments.
On the bottom layer of the pyramid is the unstructured data, which is the vast majority of available data, e.g., images, videos, and text. The challenge of unstructured data is that a structure must be imposed for analyzing the data. How this is done depends both on the data and the application. Moreover, there are often mixed formats with unstructured data. Just consider this script. We have a mixture of natural language text, images, markdown information that specifies special features of the text (headlines, listing), and even source code. How the structure is imposed depends both on the data, as well as the application.
Innovative forms of information processing
While the three Vs are usually considered as the major aspects of the definition of big data, the other parts of the definition are also important to understand why big data is not just more data, that may be generated rapidly and different formats. The next part of the definition states that innovative forms of information processing are required. This means you cannot just use a normal workstation or even a traditional batch system, where you have many computing resources to which a shared storage is attached via the network. Instead, data locality becomes an issue, i.e., preventing copies of the data due to the volume. This requires different infrastructures in which computational power and storage is combined. When big data was a new concept, such technologies basically did not exist. Nowadays, there are many ways to implement such infrastructures, e.g., with Hadoop, Spark, Kafka, Cassandra, HBase, and many others.
Insights, decision making, and process automation
The final part of the definition means that having large amounts of data is not yet big data. Data can only become big data, if it is actually used, e.g., to generate insights, guide decision making, or even automated parts of a business process. This aspect is so important, that there are also definitions of big data in which there is an additional V for value.
More Vs
We use a definition with three Vs for big data. Using words that start with V is so popular for big data, that there were multiple suggestions to extend the definition with additional Vs, with up to 42 Vs. Obviously, this is too much and was created with the goal to show that more Vs do not mean that we have a better definition for big data. Regardless, for up to Ten Vs, there are more serious definitions. We already met one the additional Vs, the value which is just called differently in our definition. Veracity is another important V that deals with the quality of the data. The more data you have, the harder it is to ensure that the data is reliable and the results can actually be reproduced. This is especially important if the data source changes often, e.g., if news outlets or social network data are analyzed. Volume, velocity, variety, veracity and value are the five V definition of Big Data, which is also popular. We do not cover any of the other Vs here.
Data Science and Business Intelligence
Data science is a relatively new term for which no agreed upon definition has emerged yet. The reason for this is likely two-fold. On the one hand, the term is very generic, i.e., every use of anything related to data that is remotely scientific can be coined as data science. On the other hand, there is a major hype surrounding the term, which means that companies, consulting firms, funding agencies, and public institutions want to advertise with their use and support of data science.
Due to this, we also do not try do find a good and concise definition for data science. Instead, we look at examples for things that fall under the term data scientist and try do understand the differences to a term that was also popular in the industry a couple of years ago, i.e., business intelligence.
What is Data Science?
Data science brings together mathematics, statistics, and computer science with the goal to generate insights and applications from data.
Mathematics plays a foundational role in how we work with data, because a common goal of many data science projects is to find a mathematical description for a certain aspect related of the data. Thus, data science is ultimately about finding mathematical models. However, the impact on mathematics goes beyond just being a "description language" for models about data. Various fields of mathematics are integral parts of the methods we use to determine models, for example, the following.
- Optimization deals with the question how optimal solutions for a target function can be found in a space of possible solutions described by constraints. This is often used to optimize the models we derive from data.
- Stochastics is used to describe the behavior of random events through random variables and stochastic process. These are the foundation for the theory of machine learning as well as for many applications.
- Computational geometry is required for analyzing data that is spatially distributed, e.g., geographically, astronomically, or on the 3D space in front of a car.
- Scientific computing is also related to data science, because more and more applications emerge where machine learning and classical scientific computing are used together.
Statistics deals with the analysis of samples of data through the inference of probability distributions that describe the data, time series analysis, and the definition of statistical tests that evaluate if assumptions on the data likely hold. Concrete aspects from statistics that are relevant for data science are, for example, the following.
- Linear models are a versatile means to fit linear descriptions to data for the analysis and may also be used for forecasting future values.
- Inference is a similar method for describing data, but mostly through probability distributions instead of linear models.
- Statistical tests are an important part in the toolbox of any scientists and can be used to determine how well models work, especially if it is likely that observed effects are only random.
- Time series analysis exploits structural patterns in temporal data to analyze the internal structure of data over time and may also be used to forecast future values.
The mathematics and statistics would not be actionable on data without computer science. Additionally, theoretical computer science is also part of the foundations of data science. Examples for concepts from computer science that are relevant for data science are the following.
- Data structures and algorithms are the foundation of any efficiently implemented algorithm and the understanding of data structures like trees, hash maps, and lists as well as the run time complexity of algorithms enables the understanding and implementation of efficient data science approaches.
- Information theory covers the concepts of entropy and mutual information which are important for many algorithms that are used for data analysis.
- Databases are the foundation of efficient storage, access, and nowadays even computation with data and SQL is an invaluable skill for any data scientists, that can often even be used with NoSQL databases.
- Parallel and distributed computing is a pre-requisite for any Big Data analysis, the scaling of problems to large groups of users, and the efficient implementation of run time extensive algorithms.
- Artificial intelligence deals with logical systems and reasoning that can also be applied in modern data science applications. Please note that we explicitly distinguish between artificial intelligence and machine learning in this script. We use the term artificial intelligence for applications like Deep Blue, the rule-based chess system that was the first computer to beat Gary Kasparow in Chess.
- Software Engineering is important for any data science approach that should be implemented in a production system, but also for the general management of data science projects.
Finally, there is machine learning, which is parts mathematics, parts statistics, and parts computer science, depending on which approaches for learning you want to use. Machine learning tries to infer knowledge from data and generalize this knowledge to other contexts, e.g., through neural networks, support vector machines, decision trees, or similar algorithms.
Examples for Applications
The field of data science is diverse and has many applications in research, industry, and society. Here are six short examples.
- Alpha Go is an example for an intelligent self-learning system. A couple of years ago, Alpha Go surprised the world because it came from seemingly nowhere and beat one of the best players of the game of Go. This was surprising, because prior to Alpha Go, computers were on the level of amateurs when it came to go and far away from even being a challenge for professional players. Alpha Go combined classical rule-based artificial intelligence with a self-learning recurrent neural network, to achieve this.
- Robotics relies on machine learning to improve how robots move. Boston dynamics is famous for teaching robots a sense of balance by pushing the robots. The robots learn how to avoid falling down over time, the same way toddlers learn this.
- Marketing and more specifically targeted advertisements in the Internet are a billion-dollar market based on learning which ads are most relevant for users based on their browsing behavior.
- Medicine relies more and more on data driven decision support. IBM Watson, who was initially famous because this was the first artificial intelligence that could beat humans in jeopardy, is now being used to help make decisions about cancer treatments. (Although this is not working as well as hoped for.)
- Autonomous driving relies on machine learning for different tasks, most importantly the recognition of objects like other cars, bikes, and pedestrians.
Differences to Business Intelligence
In the industry, business intelligence is a related ancestor of data science that has been in use for years. Gartner defines Business Intelligence as "best practices that enable access to and analysis of information to improve and optimize decisions and performance." Consequently, for many organizations data science is just a rebranding of business intelligence. However, a closer look at typical data science applications and business intelligence applications reveals the differences between the terms. The following table compares the typical techniques, data types, and common questions of business intelligence and data science.
As can be seen, business intelligence is focused on the analysis and reporting of the past. Data is typically stored in databases, structured and ready to be analyzed. Data science is more or less a superset. Everything from business intelligence may also be coined as data science, however, data science goes beyond that by considering the future. Thus, data science tries to generalize from the data such that forecasts and predictions are possible, which means more complex questions can be answered, e.g., how different scenarios will play out. This allows deeper insights than business intelligence.
The Skills of Data Scientists
Data scientists are not computer scientists, mathematicians, statisticians, or domain experts. Instead, the perfect data scientist is a combination of all of that.
- Good mathematics skills, especially about optimization and stochastics.
- Statistician with knowledge about regression, statistical tests, and similar techniques.
- Computer science skills, including programming, databases, algorithms, data structures, parallel computing, and ideally also Big data infrastructures.
- Strong knowledge in the intersection of the fields, especially machine learning.
- Enough domain knowledge to understand the data, the questions that must be answered, and how the questions can be answered with the available data.
Soft skills are also important for data scientists. Team work is often required, as data scientists often work at the intersection between domain experts on the one hand, and technical staff on the other hand. The domain experts teach the data scientists about data, the questions that should be answered, and how the outcome of projects should affect future research and/or business processes. The technical staff often takes over at some point when (and if!) projects are operationalized.
Moreover, the data scientist should be skeptical and follow the scientific method. This is especially important when dealing with data, to rule out that effects are purely random.
Because this is a very diverse and complex skill set, the proportion of people who can do all of the above is relatively small. Microsoft Research performed a survey with Microsoft employees to determine which tasks related to data science work on. They found that there are nine different types of data scientists.
- Polymaths are general purpose data scientists who fit the complete profile described above, i.e., those who can really do it all, from the underlying mathematics to the deployment of big data infrastructures.
- Data Evangelists perform data analysis and actively push for the adoption of data driven methods as well as acting on the gained insights.
- Data Preparers query existing data platforms and prepare the data for the analysis.
- Data Shapers also work on the preparation of the data but also analyze the data.
- Data Analyzers use already prepared data and analyze the data to generate insights.
- Platform Builders collect data as well as create and administrate platforms both for the collection and analysis of the data.
- Moonlighters 50% / Moonlighters 20% are part-time data scientists, that contribute to data science projects but only in a fraction of their overall work.
- Insight Actors use the outcome from data science projects and act on the insights.