
Generic Process Model
Processes
Processes are at the core of any activity, even though we are often not even aware of that. Activities are executed by people who apply techniques. The process guides and organizes the activities of the people and describes the techniques that are used.
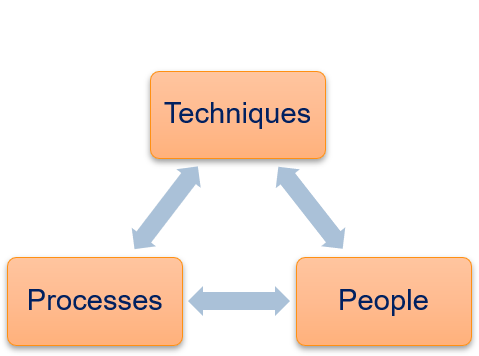
The goal of a good process model is to support the people, e.g., by ensuring that important activities are not forgotten and the recommendation of suitable tools for the solution of problems. In general, process models describe best practices that should be applied due to their past success. Through this, the reliance on the existing knowledge and skills of the people should be reduced with the aim to also reduce the risk of project failures. Processes must be supported by the people that use them. If the people do not accept a process, this can hinder productivity and increase the risk of project failures. To ensure that this is not the case, processes should have a measurable positive effect.
A good process requires that the people receive the necessary training for the techniques that should be applied. Moreover, the techniques must be suited for the project. In general, there is no "one fits all" process, because different aspects influence the choice of processes and techniques, e.g., the project size, whether there are safety-critical aspects, and prior knowledge of the people.
Overview of the Generic Process of Data Science Projects
Our generic process does not prescribe specific techniques, but only the general phases of a project, i.e., a rough sketch of the required activities. For data science projects, there are six generic phases as is shown below.
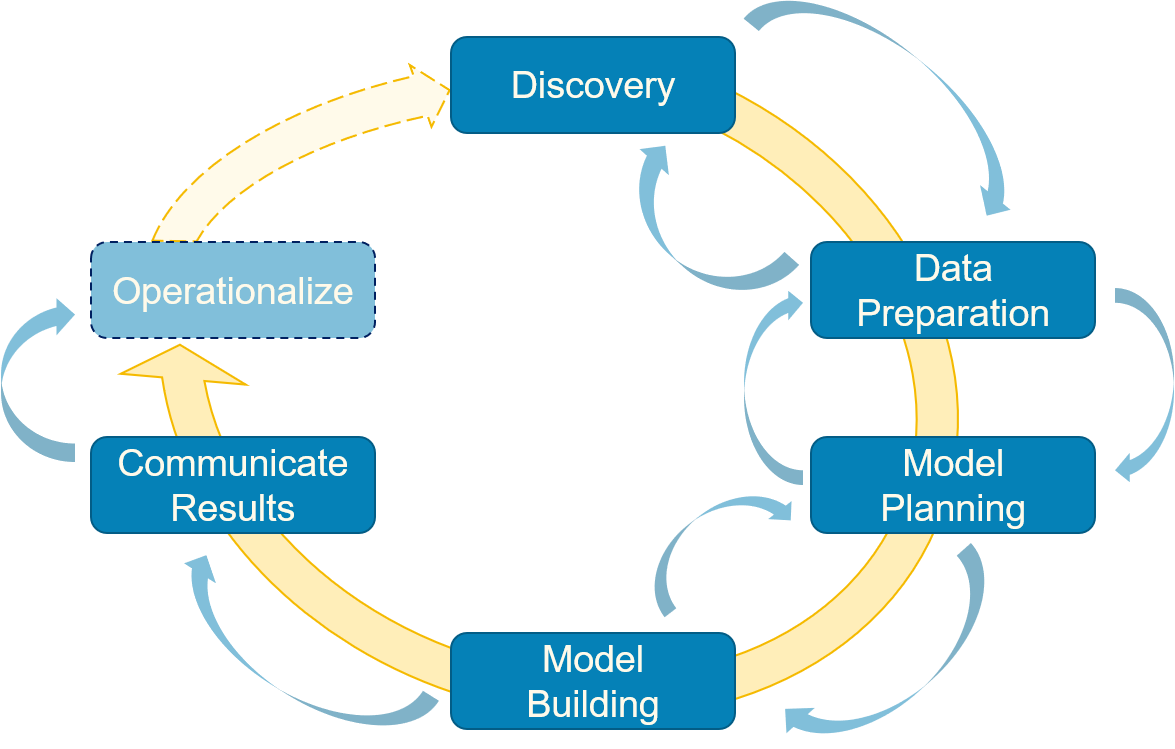
The process is iterative, i.e., there may be multiple repetitions of the phases in a project. Within one iteration, it is only possible to jump back to prior phases, until the results are communicated. The reason for this is obvious. At this point you decide that these are your results and you communicate them to a broader audience, e.g., the upper management, your customers, other researchers in form of a publication or the submission of your thesis. In the following, we consider each phase in detail.
Discovery
The discovery is the initial phase of the project. The main goal of the discovery is to understand the domain, objectives, data, and to decide if the project has sufficient resources to go forward. To achieve this, many activities must be performed.
The data scientists must acquire the required knowledge about the domain, in which the project is conducted. This means that the data scientists must understand the use case associated with the project. Domain experts often collaborate with the data scientists and provide the necessary explanations, e.g., in form of documents or through interviews and workshops. As part of this, the data scientists also gain the required knowledge about the data, i.e., a first and vital understanding about the available information assets that will be used for the analysis in the project. The gained knowledge helps the data scientists to understand the project, as well as with the interpretation of the project results.
Part of the learning about the domain should also be a consideration of the past. For academic projects, this is standard practice, as the related work must always be reviewed and considered carefully for any project. However, this is also valuable for work in the industry. Possibly, similar projects were attempted in the past. If this is the case, the results - both positive and negative - from the past projects are invaluable, as they help to avoid similar mistakes and provide guidance about working solutions. Within the bounds of the copyright and patent law, an analysis of the solutions of competitors may also help to better understand the problem as well as potential solutions.
Once the data scientist gained sufficient knowledge about the project, she can start to frame the problem. This means that the problem that shall be solved is framed as a data analysis problem. This is different from the goal of the project, which is usually a general business or research objective. The previously acquired domain knowledge is invaluable for this, as the data scientist must understand why the problem is important for the customer in order to frame it correctly. Typical questions that the data scientist must answer for this are, for example, who the stakeholders are and what their interest in the project is. The data scientists learn the current problems (pain points) as well as the goals of the stakeholders from this analysis. Based on this assessment, the objectives of the project can be clearly formulated, as well as how the success of the project will be determined. However, data scientists should not only think about the success, but also about risks that may lead to project failure by missing the objectives.
As part of all of the above, the data scientists learn about the data that may be used for the project. The data may already be readily available, e.g., in a data warehouse. However, it is also possible that data must be collected. In either case, the data scientist must get initial knowledge about the scope and structure of the data and gain a high-level understanding of the available information. Otherwise, a subsequent assessment of the required resources would not be possible.
The science part of data science should also not be neglected during the discovery. This means that data analysis should not be purely exploratory, but that clear expectations in form of hypotheses should be formulated that can be tested. Otherwise, there is a high chance that results of the projects do not generalize. Moreover, these hypotheses guide the subsequent phases of the project, especially the model planning and model building. These hypotheses should be discussed with domain experts.
Once the project is completely understood, the final step of the discovery is to decide whether to go forward with the project or not. This assessment should be done based on the risk assessment, as well as on whether the available resources are sufficient for execution of the project. At least the following resources should be considered:
- Technological resources, including resources for the data storage, computational resources, and possibly also whether the required software licenses are available or can be bought.
- The required data, i.e., if the required data is available or can be reasonable collected within the scope of the project. This assessment should look at two dimensions, i.e., the number of data points of the data that must be sufficient to achieve the objectives, as well as the information available for each data point is sufficient. Please note that the collection of additional data should be considered during the assessment of the project risks.
- The available time, both in terms of calendar time and person months. Calendar time is the duration of the project. For projects with a calendar time less than one year, the months in which the project is executed should be considered, as holiday seasons may significantly reduce the availability of personal. This further depends on the geographic distribution of the project team, as different times are critical in different countries (e.g., Lunar new year, Christmas holidays, or more or less the complete August in some countries). Person months are an estimate for the effort that developers and data scientists spent on the project. However, we note that two persons working for one year are usually not twice as productive in a project as a single person, which should be taken into account. This phenomenon is well-known and described in The Mythical Man-Month.
- Human resources, i.e., the concrete personal that should work on the project, including whether the skill set of the personal matches the requirements of the projects.
Projects should only be started if all required resources are available.
Example
Your customer is the owner of a Web shop that sells clothing. They want to increase their sales through cross-selling and ask you to design a solution for this based on data about their past sales. As part of the discovery, you may do the following:
- You interview the customers to better understand if they already have an idea how they want to increase the cross-sell. You find out that they want to place advertisements for additional products whenever something is added to the basket. This information is vital for you, as other solutions could also have been based on Email advertisements.
- You check other Web shops and look at their solutions.
- You frame the problem to predict which advertisements should be placed based on past shopping behavior of the current customer, past shopping behavior of all customers, and the current content of the shopping basket.
- You identify two relevant stakeholders. 1) The owner of the Web shop, who wants to increase the sales. 2) The customers of the Web shop who want to buy relevant products and have a good user experience. Irrelevant advertisements may lead to a decrease in user experience, while relevant advertisements may even improve the user experience.
- You do not identify relevant pain points in the current operation. The goal is not to solve an existing problem but only the optimization of the revenue of the Web shop.
- From the above, you identify two objectives:
- Increase the number of sales.
- Improve user experience through the placement of relevant products only.
- You will check the objectives by an evaluation of the increase in revenue through predictions and an evaluation of the customer satisfaction. The project is successful if the revenue increases by at least 5% and the customer satisfaction does not decrease. A drop of the customer satisfaction which reduces the revenue is the main risk of the project.
- The available data are mainly customer transactions, i.e., which products where bought together by customers including the data of shopping. The data is stored in a relational database. Other data is not available.
- You formulate three hypotheses. 1) Products which were frequently bought together in the past, will be frequently bought together in the future. 2) There are seasonal patterns in the sales (e.g., summer clothing, winter clothing), which are relevant for the recommendations. 3) The category to which items belong is relevant for the cross-sale, especially the brand and the type of clothing.
- You find that the resources that are available are sufficient for a pilot study that evaluates the feasibility of such predictions for cross-sell. However, an assessment of how this will affect the user experience as well as a roll-out into production cannot be achieved with the resources available and would have to be done in a separate project.
Data Preparation
After the discovery the technical work on the project starts with the data preparation. The data preparation has two major goals: 1) the preparation of the infrastructure for the data analysis and the loading of all relevant data into that infrastructure; and 2) gaining an in-depth understanding of the data.
The effort for the preparation of the infrastructure is somewhere between writing a few lines of code and a huge effort that consumes several person years of resources. If the data is relatively small and easy to access, e.g., through a single SQL query or by loading the data from a comma separated value file, this is trivial. However, if you are dealing with big data, if you also have to collect the data, or if the access to the data is difficult due to some other reason (e.g., data privacy concerns), this can be quite difficult and may require lots of effort.
The general process for getting the data into the infrastructure is called ETL: extract, transform, load. First, the data is extracted from where ever it is currently stored. This means writing code for loading data from files, databases, or potentially collecting the data from other sources through tools, e.g., through Web scraping. Once the data is extracted it is transformed into the required format. This transformation usually includes quality checks, e.g., to filter data with missing values or data that contains implausible values that are likely wrong. Moreover, data must often be (re-)structured and converted into different formats. For example, content from blog posts may have to be split into different fields, e.g., title, content, and comments, character encodings may have to be harmonized, and time stamps might need to be converted into a common format. Once all this is done, the data can be loaded into the analysis environment.
A variant of ETL is to switch the transformation and the loading, i.e., ELT. In this case, the raw data that is extracted and loaded directly into the analysis environment and all subsequent transformation are already performed inside the analysis environment. Whether ETL or ELT is a better choice depends on the use case. A common argument for using ELT instead of ETL is that the transformations may be so complex, that they require the computational power of the analysis environment. Moreover, ELT allows the evaluation how different transformations influence the results, because they can be changed flexibly, including access of the raw data for the analysis. A common argument for ETL over ELT is that transformations may be too time consuming to perform them possibly repeatedly after reloading the data.
The second major aspect of the data preparation is to get an in-depth understanding of the data. For this, the data scientists must study the available documentation about the data and apply the domain knowledge to understand what the data means. Ideally, the data scientists know the meaning for every single type of data there is, e.g., every column in a relational database, or what different document types there are in a text mining problem and how a structure can be imposed on this unstructured data. This type of work can be categorized as understanding the meta data, i.e., the data about the data.
However, the data should also be considered directly, i.e., the data should be explored - an activity that is tightly coupled with the transformations of ETL. This means that data scientists should consider relevant statistical markers and visualize data (Chapter 3). The goal is, e.g., to understand the distribution of numeric data, identify invalid data, determine and remove differences in scales of the data for further harmonization. Additionally, data scientists should try to identify which data they actually need and which data may be removed. While dropping irrelevant data early carries the risk that data is dropped that may actually be useful, it can also be of great help if the volume of the data is reduced significantly. Data scientists should always assess this trade-off.
At the end of the data preparation, all relevant data should be available in the analysis environment and relevant pre-processing steps to transform the data into the required representation should have been performed.
Example (continued)
The sales data is stored in a relational database and consists of 352,152 transactions. Each transaction has on average 2.3 items that were bought and is associated with a time stamp in the ISO 8601 format, as well as the anonymized identifier of the user who bought the items. A separate table stores additional information about the items, e.g., the price, as well as a list of categories to which the item belongs (e.g., male clothing, female clothing, trousers, sweater, socks, brand). There is also additional data available, e.g., the payment type, which you decide to drop for your analysis because you do not expect a reasonable relationship to cross-sell.
The overall volume of the data is about one Gigabyte. You decide to use an ELT process, because loading the from the database only requires about one minute and you can then flexibly explore the data while you define the required transformations.
During the data exploration you identify 2,132 transactions without items, which you drop because these are invalid data. Moreover, you note that certain brands are bought very infrequently. You decide to merge all these brands into a new category "Other brand".
You decide to create four different representations of the transactions to facilitate using different information in the downstream analysis:
- The items as is.
- The items replaced with the type of the clothing (socks, ...).
- The items replaced with the brand.
- The items replaced with the combination of type and brand.
Model Planing
The goal of the model planning is to design the models for the data analysis. This means that you must decide how exactly you want to analyze the data and which models you want to use to gain insights. The models must be suited both for the use case and the available data. There are different aspects that influence the candidates for suitable models. The goal of the analysis usually prescribes the type of model that may be used.
- Association rule mining can be used if the goal is to identify rules that describe relevant relationships within transactions (Chapter 5).
- Clustering can be used to identify groups in a large set of data (Chapter 6).
- Classification can be used to predict to which category objects belong (Chapter 7).
- Regression can be used to describe relationships between variables and to predict numeric values (Chapter 8).
- Time series analysis can be used to analyze temporal data (Chapter 9).
There are different ways to build, e.g., classification models. There are additional considerations which can help with the choice of a suitable model. For example, it may be important to gain a detailed understanding of why a model predicts a certain outcome. In this case, a white box model must be used, where the inner workings are understandable for the data scientists - and possibly also domain experts. In case understanding of the inner workings of a model is not necessarily required, black box models can also be used. For most problems, black box models (e.g., neural networks) have a higher performance ceiling than white box models (e.g., decision trees).
Another consideration for the choice of model is the volume of the data and the computational resources that are available. Not every model scales equally well with large amounts of data. Moreover, some models work only with massive amounts of data, others work better with smaller amounts of data. Because all this must be considered, data scientists should have a broad knowledge about different modeling approaches, because there is no silver bullet that can solve all problems.
However, the selection of the model that should be trained is only a small part of the model planning. Depending on the data, you may also have to model the features that your models use and select which features you want to use (more on features in Chapter 4). You should also plan how you want to evaluate the results, e.g., how you want to score different models, if and how you want to statistically compare different models you evaluate, and how you may use visualization to support the analysis of the results. Finally, you have to decide how you want to use your data. For many use cases, data needs to be separated into different sets, i.e., training data, test data, and possibly also validation data (more on this also in Chapter 4). For big data, it is usually also a good idea to extract a small sample of "toy data" that you can use locally to test your programs
Example (continued)
You decide to use an association rule mining approach (apriori algorithm) to identify items that are frequently bought together and you want to evaluate how well the approach works on the different data sets you prepared. For the cases where you replaced the items with categories, you want to create a regression model (random forest regression) that predicts scores to model which concrete items are often bought, given that products from other categories are already in the basket. Depending on the results, you already consider that you may need to improve your models in a second iteration, as you see a risk that only cheap products will be recommended, which may lead to cross-sell, but without a strong increase in revenue. You will create visualizations that show which products are often bought together in form of a graph. You split your data based on the time stamp and use the oldest 50% as training data, the next 25% as validation data, and the newest 25% as test data.
Model Building
The model building means that you implement the code to create the models you planned from the data you have. Often, there are multiple iterations, i.e., after the models are built and initial evaluation is done. Based on these preliminary results, there might be another cycle of model planing and model building, to further improve the models and mitigate problems that may have been detected. However, when this is done iteratively, it is important that the test data is not used multiple times. The test data may only be used once, i.e., after the last time the models were built. Otherwise, the test data degenerates into validation data (Chapter 4).
The main reason the model building is a separate phase from the model planning is that there are use cases where this can be very expensive and time consuming, e.g., in case a huge neural network is trained with distributed resources in a cloud system.
Example (continued)
You decide to implement the model in Python using pandas, scikit-learn, and mlextend. The model can be trained and evaluated on a normal workstation.
Communication of Results
At some point, a decision must be made that the cycle of model planning and model building stops and the final results based on the test data are generated. Once these results are available, they must be presented to the relevant stakeholders. The main question that must be answered is whether the objectives are achieved or not and, consequently, if the project was successful. Moreover, key points about the results should be made, e.g., not only if an approach may be cost efficient, but also an estimate of the expected Return on Investment (ROI). Other interesting key points may be unexpected findings, e.g., relationships within the data that were not expected by the domain experts. For research projects, make clear how your approach advances the state of the art, beyond just being a couple percent better in some performance metric.
Example (continued)
You found that a recommendation system based on association rules for categories in combination with the prediction of the most suitable items through regression performs best. You estimate that the sales may increase by 10% generating 6% more revenue. Moreover, you found that the models only work reliably, if you separate the items by the gender they are targeting in the regression model. Otherwise, the model would nearly always predict female clothing.
Operationalization
If the project delivered good results, it may be decided to put the result into an operational product. This usually means a significant effort must be spent in the re-implementation of the model, such that it runs in a scalable way in the production environment. This might mean that the whole code must be rewritten, e.g., to be running directly within a database.
When a model is migrated into operation, this should be done with care. Ideally, it would be possible to start with a smaller pilot study. The pilot serves as additional safety net and should be used to evaluate if the expectations derived from the results on the test data really generalize to the application of the approach in the real world. Differences may surface, e.g., because users do not act on predictions as expected or simply because the behavior changed between the collection of the test data and the current state.
This is also a vital issue that should not be neglected when approaches are operationalized: because data ages, models age as wells. This means that they may become outdated and the performance may deteriorate over time. To counter this, a strategy for the re-training of models should be defined, that includes when this is done, how and by whom this is done, how the newer models will replace the current models, and how it will be measured if the performance regresses.
Example (continued)
Your customer was satisfied with the results of the project and decided to operationalize the approach and run a pilot study. For the pilot study, the predictions are shown to a randomized group of users. The pilot shall run for one month. Regardless of the survey, each user is invited to participate in a user survey regarding the user experience of using the Web shop. If the results of the user survey indicate no drop of the user satisfaction and there was a sufficient amount of cross-sell, the approach will be adopted for all customers.
Roles within Data Science Projects
Within every process, people fulfill roles to execute a project. Meriam-Webster defines roles as follows.
Definition of Role
A function or part performed especially in a particular operation or process.
Thus, roles define the responsibilities of the people working within a process. In practice, roles are often related to job titles, e.g., "Software Engineer", "Project Manager", or "Data Scientist". In general, there is no one-to-one mapping between roles and people. One person may fulfill several roles and one role may be fulfilled by several people. For example, there may be multiple people with the role "Data Scientist" in a project, and people with the role "Data Scientist" may also have other roles, e.g., "Project Manager" or "Database Administrator".
We discuss seven roles within data science projects. Please note that this is likely not sufficient, especially for larger projects, or for the operationalization of projects. In this case, additional roles may be required, e.g., software engineers, software architects, cloud architects, community managers, and testers. Moreover, we discuss the roles from an industrial perspective. However, each role has academic counterparts, which we also mention. The following tables lists the roles and their descriptions.
Business User
The business users are those that will be directly using the potential results of your project. Business users are important stakeholders and domain experts that should be consulted to better understand the data, the value of results, as well as how results may affect business process if they are operationalized. In academic projects, business users are anyone who may directly use your research in their daily work, either directly, or indirectly.
The business users are usually not part of the day-to-day business within projects.
Project Sponsor
Without the project sponsor, there would not be a project. They are responsible for the genesis of the project and provide the required resources. This may be upper management or an external customer. The sponsors are also part of the evaluation of the project success. They determine if the project was successful or not based on the final results. They also determine if additional funding should be made available and usually also decide if a project is operationalized. In academia, the projects sponsors are the principle investigators of projects, usually professors and post-docs.
The project sponsors are usually not part of the day-to-day business within projects.
Project Manager
The project manager is the organizer of the project work and the day-to-day business. This includes the planning and management of resources (monetary, human, computational), as well as the controlling of the project progress. The project manager ensures the milestones are achieved and objectives are met on time and with the expected quality. The project manager regularly assesses the risks and possibly implements corrective measures to mitigate the risks. In the extreme case this may also mean that the project manager has to abort projects or request additional resources, because a successful completion of the project may not be possible with the required resources. In academic projects, the project manager is often the same person as the project sponsor, or someone working for the project sponsor, e.g., a post-doc or a PhD student working in the lab of a professor.
Business Intelligence Analyst
The business intelligence analyst is the traditional business intelligence role. The business intelligence analysts are usually also domain experts, although not business users. Additionally, they know the data very well and are experts on creating reports from the data, including the key performance indicators (KPIs) relevant for the domain. This role does not really exist in academia. The closest thing would be a researcher, who is, e.g., used to evaluating taxonomies manually, but not through algorithms.
Data Engineer
The data engineer is involved in the ETL/ELT of the process and responsible with making the data accessible in the analysis environment in a scalable manner. Data engineers require strong technical skills if data still needs to be collected and in big data projects. In most academic projects, there is no separation between the data engineer and the data scientist. In some disciplines, e.g., genomics, data engineers may exist in the role of preparing genomic data from the lab for use with bioinformatics tools or in high energy physics, where whole teams prepare the huge amounts of data collected for further analysis.
Database Administrator
The database administrator supports the data engineer and the data scientists through the deployment and administration of the analysis environment for the project. The tasks include the installation and configuration of (distributed) databases, software for distributed computing in compute clusters, and the provision of the required tools for the analysis. In academic projects, this role is not separated from the data scientist, or the administrator of the research institute or related compute center fulfills this role.
Data Scientist
The data scientist is the expert with respect to the analysis of the data and modeling. The data scientist has deep knowledge about data analysis techniques and is able to select suitable techniques to achieve the desired business objective. The data scientist is responsible for the analysis of the data and has to ensure that the analysis objectives are met. If this is not possible, the data scientists must communicate this as soon as possible to the project manager, as this is usually a major risk within data science projects. In academia, this role is usually the researcher who executes a project.
Core Deliverables
A deliverable is a tangible or intangible good or service produced as a result of a project. The required deliverables are often specified as part of contracts and often associated with project milestones. Deliverables must meet the stakeholder's expectations for the project to be successful. For a data science project, there are four core deliverables that are usually required.
Sponsor Presentation
The sponsor presentation is for the big picture and a non-technical audience, e.g., business users, project sponsors, and the project management. The focus of the sponsor presentation should be on clear takeaway messages that are related to the business use case. For example, the performance of a model should not be given in some machine learning metrics, but rather in business metrics. This means that you do not mention "true positives", but "the percentage of correctly identified defaulting customers". The presentation should be designed to support decision making. What exactly this means depends on the state of the project and the audience. For business users, the presentation may be tailored such that improvements of the business process are highlighted to motivate the business users to adopt the approach. For project sponsors, the goal may be to aid their decision whether the results of the project should be operationalized or not.
Visualization should be simple and on point. Bar charts, line charts, and simple histograms. In case of histograms, the bins should make sense for the business users. The visualizations should support the results regarding the key performance indicators. Detailed visualizations that present in depth how and why your models work should not be used within a sponsor presentation.
Analyst Presentation
The analyst presentation is aimed at a technical audience, e.g., fellow data scientists. This presentation should also cover the big picture, especially key performance indicators should also be presented. However, the analyst presentation should also cover how the data was analyzed. This should include the general approach that was used, but also concrete algorithms. Depending on the audience, and the available time, it may even be a good idea to include relevant implementation details. In general, the presentation should not focus on "the obvious". If standard techniques are used, there should not be lengthy description of them. Instead, the presentation should focus on interesting aspects, e.g., unexpected problems, creative solutions, new inventions to improve performance and similar aspects.
Moreover, the presentation should cover how the project results go beyond the state of the art, especially in research presentations. However, you may also address in industrial use cases how your project would change the current state of practice and how business processes need to be adopted and may possibly be improved.
The analyst presentation can be more complex. This also means that you can use more complex visualizations, for example box plots, density plots, ROC curves, and error bars for confidence intervals. Regardless, this is not a free pass for arbitrary complex graphics. The presentation should still be clean and not overloaded.
Code
The developed model in form of code is usually also a deliverable. The developed code is often prototypical, e.g., not a cleanly coded library that can easily be included and re-used, but rather a couple of files with scripts that can be executed. In the worst case, these scripts may even contain workstation depend code, like absolute file paths. Clean code is often a secondary concern, the focus on the code is usually on creating a good model and the estimates of the performance.
The code is at the same time the exact specification of the models. Therefore, the code - regardless how "hacky" - is a valuable resource. The code may be re-used, re-written, or adopted or cleaned up. This can be especially valuable during the operationalization. When the code is re-written, the old code can also be used for comparison, e.g., to check if the results are unchanged.
Technical Specifications
The code does not live on its own. Code requires documentation and specifications. This documentation should describe the environment in which the code can be executed, e.g., which operation systems are supported, which other software is required, how dependencies can be installed, and how the code can be run. This is, unfortunately, often neglected. Technical specifications are often missing, outdated, or incomplete. This lack of documentation may mean that the code becomes unusable. Regardless, good data scientists ensure that this is not the case. In research, this may mean that a replication package is provided together with a publication that contains all code and additional documentation required for running the code. In industrial projects, this should be a standard part of the packaging of the source code.
Data as Deliverable
When data is collected or significantly pre-processed and cleaned up during a project, the data itself may also be deliverable. Sharing of the data may enable future projects and help with the testing of re-implementations during the operationalization. Data sharing is especially important in academia. Without the sharing of data, research cannot build on each other. Moreover, replications and the reproduction of prior results may not be possible.
How data can be shared depends on the sensitivity and the amount of data. Sharing of big data is difficult, as it may actually be impossible to create download links. In this case, the data may be shared through multiple smaller packages or by providing an access point to the database that allows external querying of the data. If the data contains personal data, sharing may not be simple and require dedicated data privacy agreements or prior anonymization. In the industrial context, data can be shared internally within a company. In research, data sharing should follow the FAIR. Thus, the data must be findable (e.g., with a Digital Object Identifier (DOI)), accessible (authentication support if required), interoperable (provides all information required for use by others), and reusable (has a license and is in line with community standards). Ideally, not only the data is shared, but also the protocols and tools used to create the data.